• Nike เผยงบ F3Q24 โดยรายได้เพิ่มดีกว่าคาด 0.3%YoY หนุนจากยอดขายอเมริกาเหนือ+3.2%YoYและจีน +4.5%YoY
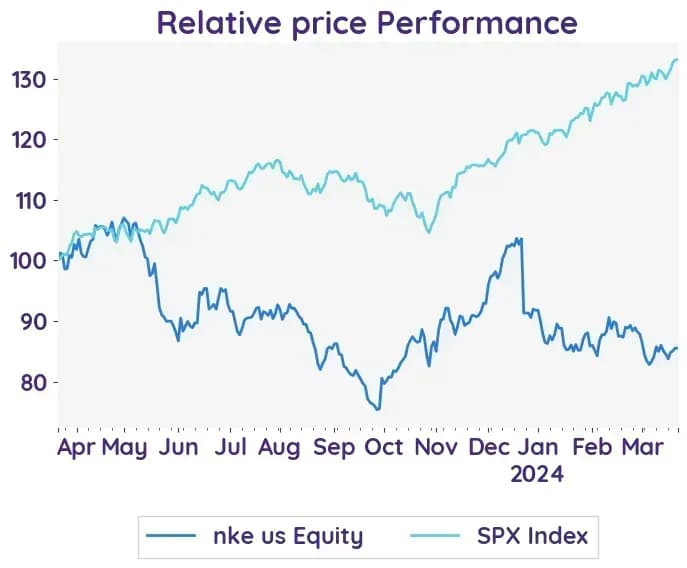
• อย่างไรก็ดีราคาหุ้นในช่วงก่อนเปิดตลาดปรับตัวลงราว 6% หลัง 1) ถึงแม้สินค้าคงคลังลดลงมากกว่าคาด แต่ GM ยังออกมาต่ำกว่าคาด 2) บริษัทให้คาดการณ์รายได้ใน 1H25 หดตัวลงสะท้อนภาพธุรกิจที่ยังฟื้นตัวได้ไม่เต็มที่
คลิกเพื่อลงทุนเลย


22 March 2024 NIKE, Inc NKE
Bloomberg NKE.US
Reuters NKE
Nike Forecasts Revenue Drop in Upcoming Half-Year Period
Earnings Result
In comparing the previous and current quarter financial reports of NIKE, Inc., there are several key highlights. Firstly, the company experienced a 1% increase in revenues compared to the previous year, with NIKE Direct revenues up 6% and NIKE Brand Digital sales up 4%. However, wholesale revenues were down 2%. The gross margin also increased by 170 basis points to 44.6% in the previous quarter and further increased to 44.8% in the current quarter. Diluted earnings per share saw a significant increase of 21% in the previous quarter, but decreased to $0.77 in the current quarter due to restructuring charges. Despite this, the company remains optimistic about future growth and is focused on maximizing the impact of its new innovation cycle.
Net profit still declined
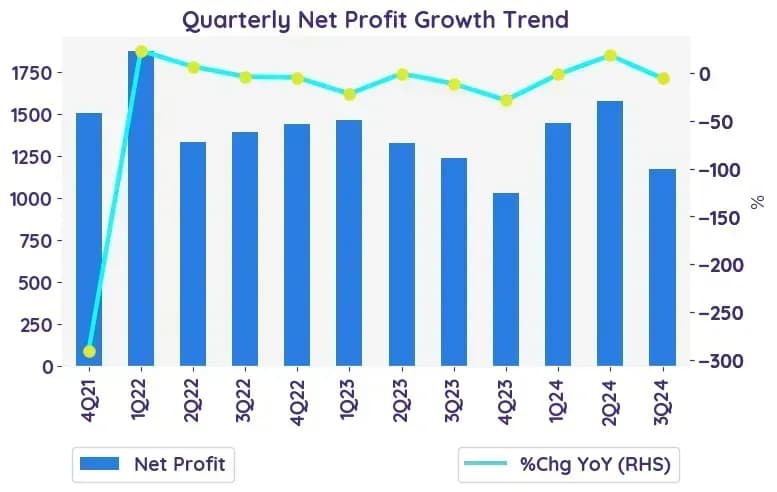
The net income of NIKE, Inc. decreased by 2 cents compared to the previous year but beat expectation. This decline in net income can be attributed to higher income tax expenses. Overall, NIKE, Inc. experienced moderate growth in net income compared to the previous periods.
Modest Revenue Growth
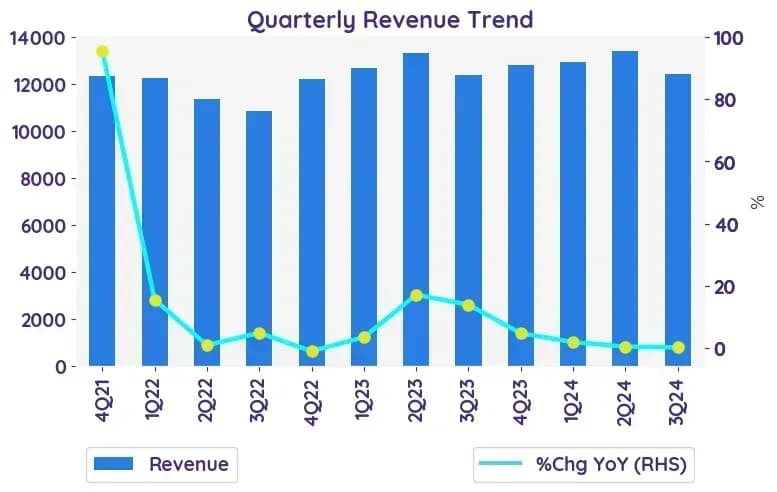
The company reported a revenue of 12.43billion, beating estimate of 12.31 billion by 0.3% year-over-year. The total NIKE BRAND revenues increased by 2% to $11,948 million, with growth in both footwear and equipment categories. However, there was a decline in apparel and global brand divisions revenues. The report also mentions that the revenue growth was impacted by currency exchange rate fluctuations.
Nike's Profitability
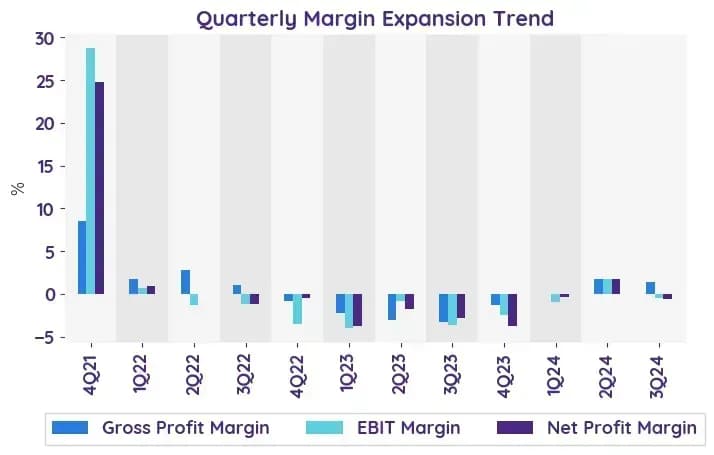
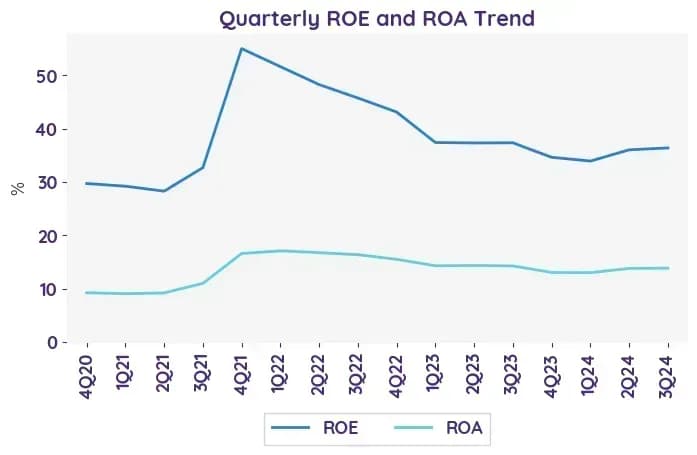
The gross margin for NIKE, Inc. increased by 150 basis points to 44.8% due to strategic pricing actions and lower ocean freight and logistics costs. However, higher product input costs and restructuring charges partially offset this increase. The operating margin, or EBIT margin, for NIKE, Inc. decreased from 11.9% to 10.9% for the three months ended February 29, 2024, and from 13.0% to 12.6% for the nine months ended February 29, 2024.
Balance sheet and cashflow
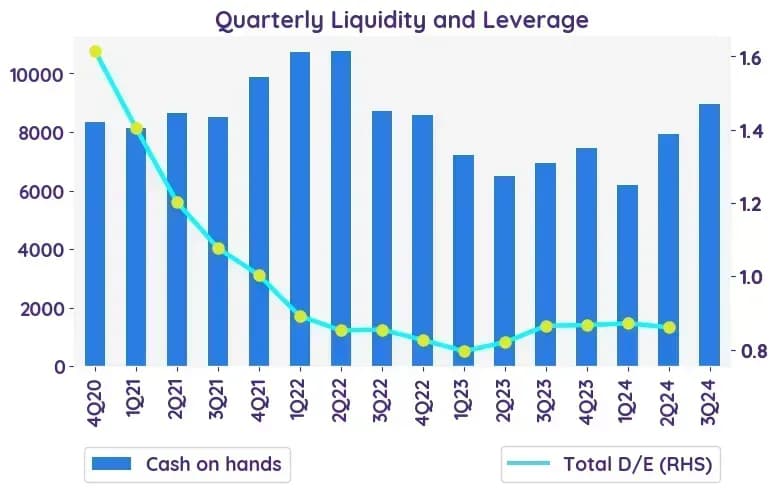
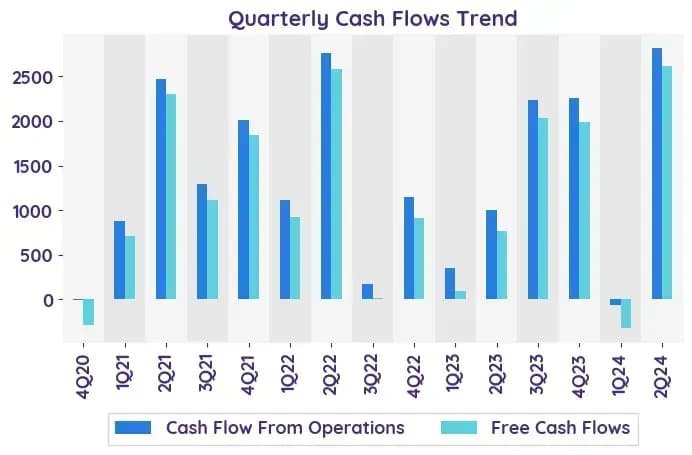
Nike's balance sheet showed a decrease in current assets, particularly in short-term investments and inventories. However, the company's cash and equivalents remained relatively stable. On the liabilities side, current liabilities decreased slightly, while long-term debt remained unchanged. The cashflow analysis revealed that cash generated by operations was offset by share repurchases, cash dividends, capital expenditures, and bond repayment. Overall, the balance sheet and cashflow analysis indicate some fluctuations in assets and liabilities, but the company continues to invest for growth and increase returns to shareholders.
Business Outlook
Nike expects low single-digit revenue decline in the next fiscal year's first half, but sees full-year revenue and earnings growth excluding restructuring impacts, with Q4 revenue slightly up.
Revenue - %Chg YoY | 1Q24 | 2Q24 | 3Q24 | 4Q24 | 1Q25E |
|---|
Footwear | 3.8% | 1.2% | 2.4% | 2.2% | 2.3% |
Apparel | -1.3% | -0.5% | -2.7% | 1.8% | 0.7% |
Equipment | 9.3% | 17.4% | 20.8% | 4.2% | 1.9% |
Global Brand Divisions | -7.1% | -33.3% | -25.0% | -1.5% | 1.5% |
Sentiment | 1Q24 | 2Q24 | 3Q24 | 4Q24 |
|---|
net profit | Negative | Neutral | Positive | Neutral |
margin | Negative | Neutral | Positive | Neutral |
revenue | Positive | Neutral | Positive | Neutral |
Stock data | |
|---|
Market Cap (USD Million) | 152.75 |
Beta | 1.16 |
Last close | 100.82 |
12-m Low / High | 88.7 / 128.7 |
Target price | 120.00 |
Return Potential | 19.0 % |
% of Buy / Sell rating | 59.0 % / 9.0 % |
Valuation data | 12m Forward | 5-Yr Average |
|---|
P/E | 25.61 | 37.34 |
P/B | 10.92 | 14.61 |
P/S | 2.95 | 3.85 |
EV/EBITDA | 21.48 | 24.98 |
Dividend Yield | 0.0 % | |
NIKE, Inc
NIKE, Inc. designs, develops, and markets athletic footwear, apparel, equipment, and accessory products for men, women, and children. The Company sells its products to retail stores, through its own stores, subsidiaries, and distributors. NIKE serves customers worldwide.
Download Earnings Brief Report
By Sittichai Duangrattanachaya, powered by AI
Contact : e-mail: [email protected], tel. 02-294-1031 InnovestX Research

