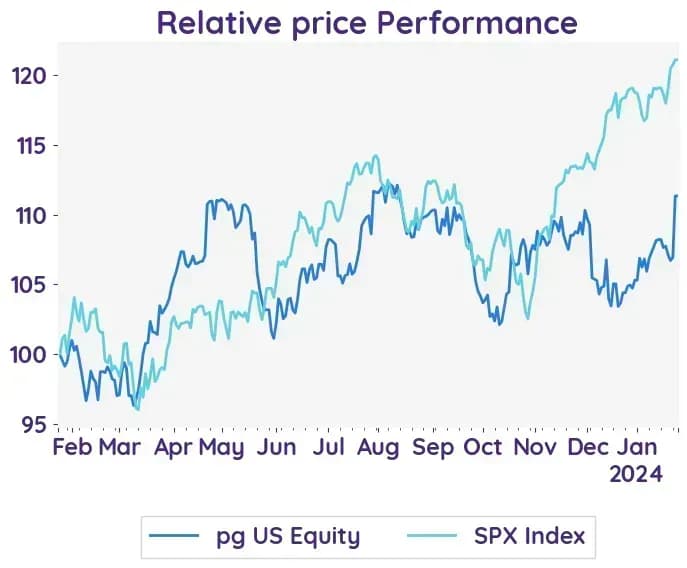
• P&G เผยงบไตรมาส 2Q24 กำไรดีกว่าคาด EPS +16% YoY อยู่ที่ $1.84 ต่อหุ้น สูงกว่าคาดการณ์ราว 7.9% ขณะรายงานยอดขายเพิ่มขึ้น +3% YoY ในไตรมาส 2Q24 แต่ต่ำกว่าคาดการณ์
• บริษัทให้คงมุมมองรายได้สำหรับรอบปี Fiscal Y2024 ไว้ที่ 2% ถึง 4% หลังมองการเปลี่ยนแปลงของค่าเงินอาจเป็นปัจจัยกดดัน
• ด้าน Bloomberg ให้ราคาเป้าหมายไว้ที่ 165.0 USD ซึ่งมี Upside 7.2% จากราคาปัจจุบัน



24 January 2024 The Procter & Gamble Co PG.US
Bloomberg PG.US
Reuters PG
P&G shows strong growth in sales and EPS, indicating a positive future earnings trend.
Earnings Result
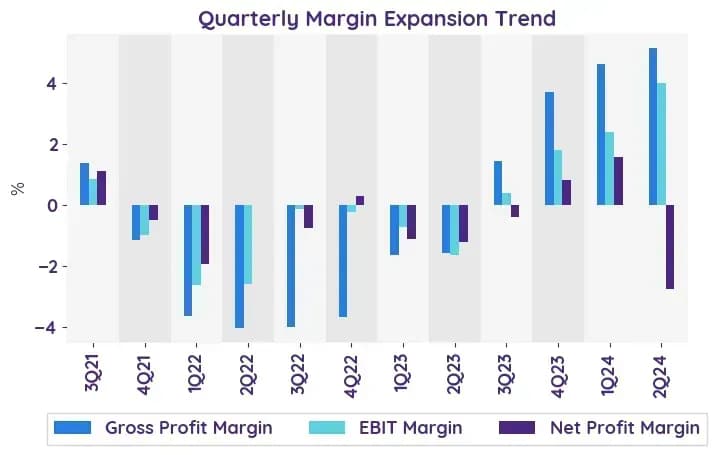
The comparison between the previous and current quarter financial results of Procter & Gamble (P&G) reveals some notable differences. While the previous quarter showed a strong increase in net sales and organic sales, along with a significant rise in diluted EPS and core EPS, the current quarter saw a smaller increase in net sales and organic sales. Additionally, diluted EPS decreased, but core EPS increased. P&G has maintained its sales and cash return guidance for the fiscal year, but has updated its GAAP EPS outlook and raised its core EPS growth guidance. These changes indicate potential challenges and uncertainties that may impact the company's future earnings.
Net profit
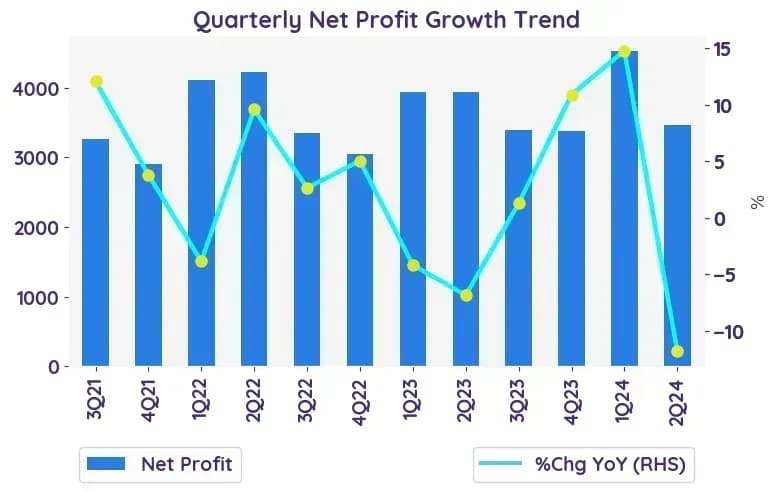
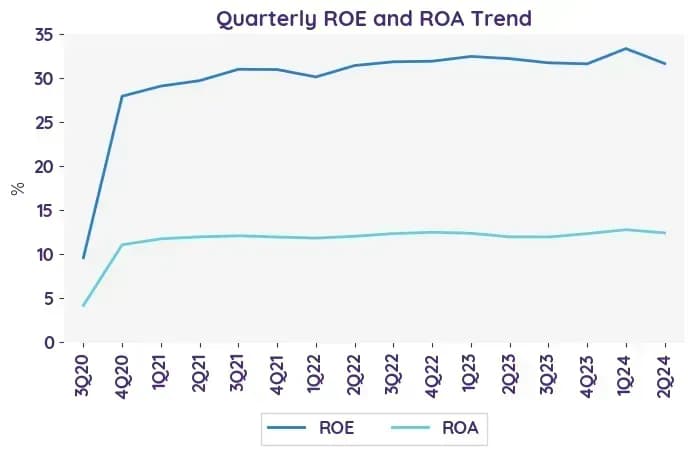
For 2Q24, the core EPS rose by 16% year-over-year to $1.84 per share, beating expectations by approximately 7.9%.
Revenue growth of each business
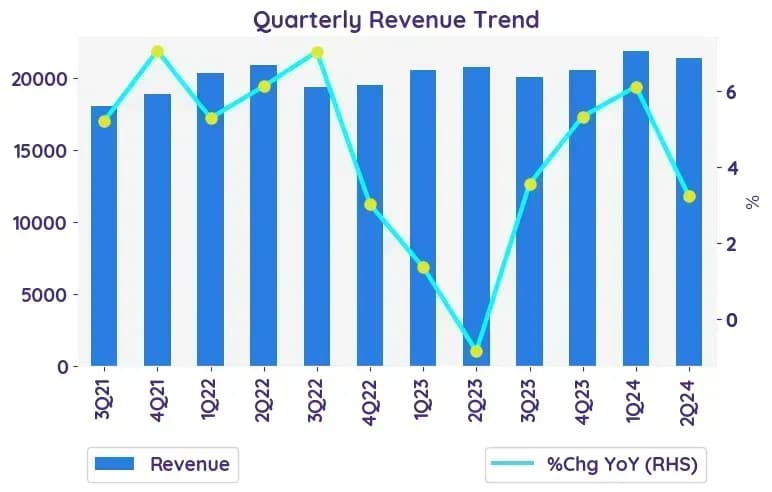
In the second quarter of fiscal year 2024, Procter & Gamble (P&G) reported a 3% increase in net sales compared to the prior year but missed expectation. Organic sales, which exclude the impacts of foreign exchange and acquisitions/divestitures, increased by 4%. The revenue growth for each business segment in the October-December 2023 quarter is as follows: Beauty - 1%, Grooming - 6%, Health Care - 4%, Fabric & Home Care - 5%, Baby, Feminine & Family Care - 2%, Total Company - 3%. These figures represent the organic sales growth, excluding the impacts of foreign exchange and acquisitions/divestitures.
Fiscal Year 2024 Guidance
P&G maintained its guidance range for fiscal 2024 all-in sales growth to be in the range of two to four percent, with foreign exchange expected to be a headwind. The company adjusted its fiscal 2024 diluted net earnings per share growth due to the impairment of the Gillette intangible asset value and the restructuring program. P&G raised its fiscal 2024 core net earnings per share growth and expects unfavorable foreign exchange rates, interest expense, and interest income to be headwinds. The company expects tailwinds from favorable commodity costs and estimates capital spending to be approximately 4% of fiscal 2024 net sales. P&G also expects a core effective tax rate of approximately 21% in fiscal 2024.
Operating Cash Flow
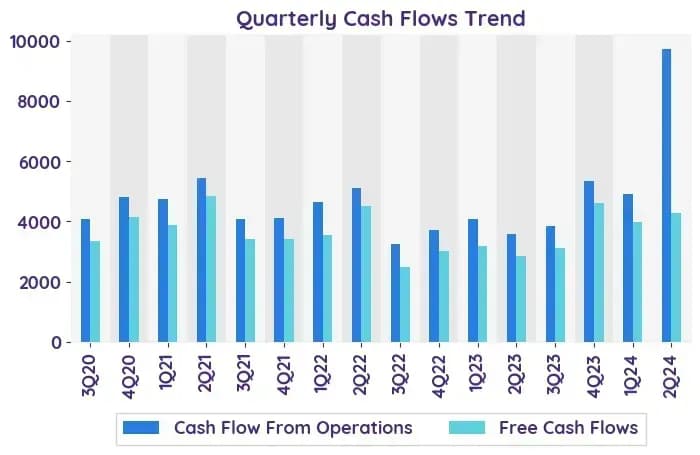
In the quarter, the company reported an operating cash flow of $5.1 billion and net earnings of $3.5 billion. Adjusted free cash flow productivity stood at 95%, derived from operating cash flow minus capital spending as a percentage of net earnings excluding the Gillette impairment charge. Additionally, $3.3 billion was returned to shareholders, comprising about $2.3 billion in dividends and $1 billion in share repurchases.
Risks and concerns
The current risks that the company is facing include managing global financial risks, economic volatility, disruptions in credit markets, supply chain disruptions, cost fluctuations, competition, customer relationships, and reputation management.
Organic Revenue Growth - %Chg YoY | 3Q23 | 4Q23 | 1Q24 | 2Q24 | 3Q24E |
|---|
Beauty | 7.0% | 11.0% | 5.0% | 1.0% | 2.6% |
Grooming | 7.0% | 8.0% | 9.0% | 9.0% | 2.9% |
Health Care | 9.0% | 5.0% | 10.0% | 2.0% | 4.7% |
Fabric & Home Care | 9.0% | 8.0% | 9.0% | 6.0% | 4.4% |
Baby, Feminine & Family Care | 6.0% | 9.0% | 7.0% | 3.0% | 3.6% |
Sentiment | 3Q23 | 4Q23 | 1Q24 | 2Q24 |
|---|
net profit | Positive | Negative | Positive | Negative |
margin | Neutral | Negative | Positive | Neutral |
revenue | Positive | Neutral | Positive | Negative |
Stock data | |
|---|
Market Cap (USD Million) | 362.32 |
Beta | 0.62 |
Last close | 153.98 |
12-m Low / High | 135.8 / 158.4 |
Target price | 165.00 |
Return Potential | 7.2 % |
% of Buy / Sell rating | 61.0 % / 6.0 % |
Valuation data | 12m Forward | 5-Yr Average |
|---|
P/E | 23.12 | 24.35 |
P/B | 7.74 | 7.00 |
P/S | 4.27 | 4.31 |
EV/EBITDA | 16.95 | 17.92 |
Dividend Yield | 0.0 % | |
The Procter & Gamble Co
The Procter & Gamble Company manufactures and markets consumer products. The Company provides products in the laundry and cleaning, paper, beauty care, food and beverage, and health care segments. Procter & Gamble products serves customers worldwide.
Download Earnings Brief Report
By Sittichai Duangrattanachaya, powered by AI
Contact : e-mail: [email protected], tel. 02-294-1031 InnovestX Research

