ก่อนไปคิดอะไร
- คาด 2Q65 การบริโภคในประเทศบางส่วนจะได้รับผลกระทบจากเงินเฟ้อที่สูงขึ้นและอาจส่งผลต่อยอดขายภายในประเทศ สินค้าใหม่ในกลุ่มกัญชงและกัญชาทั้งเครื่องดื่มและขนมขบเคี้ยวคาดยอดขายชะลอตัว รวมถึงการออกสินค้าใหม่มีแนวโน้มล่าช้า แนวโน้มผลประกอบการ 2Q65 คาดเติบโตทั้ง QoQ และ YoY จาก volume ที่สูงขึ้น
หลังไปได้อะไร
- ยอดขายรวมของ 2Q65 คาดเติบโตได้ดีทั้ง YoY และ QoQ โดยคาดการเติบโตของยอดขายในประเทศที่ 13% YoY และ 7% QoQ ปัจจัยหนุนจากฤดูกาล ขณะที่ยอดขายจากต่างประเทศเติบโต 67% YoY และ 56% QoQ ทำ Record High โดยได้แรงหนุนจากประเทศเวียดนาม ขณะที่ทิศทาง Gross margin อ่อนตัวลง QoQ และ SNNP จะพิจารณาเลื่อนการออกสินค้าใหม่ในกลุ่มกัญชาและ CBD เพื่อรอความพร้อมของตลาดและกฎเกณฑ์
ความเห็นและกลยุทธ์การลงทุน
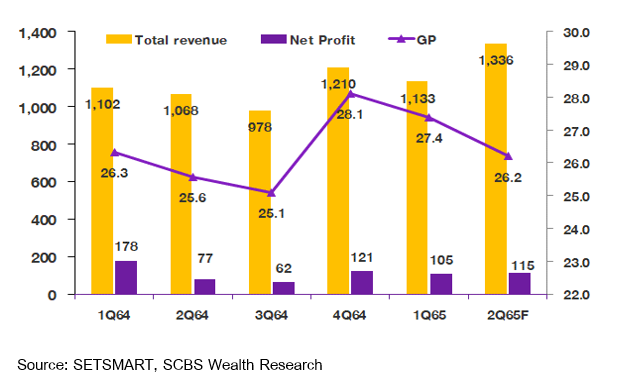
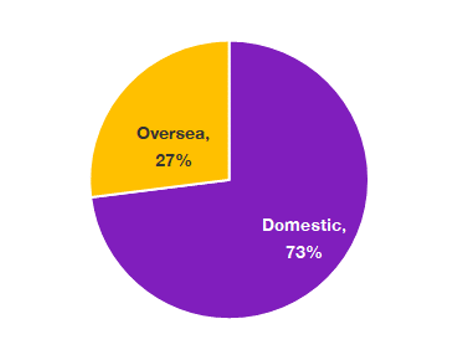
- เราคาดกำไรสุทธิของ SNNP ใน 2Q65 ที่ 115 ล้านบาท (+50% YoY และ +9% QoQ) รายได้คาดที่ 1,336 ล้านบาท (+25% YoY และ +18% QoQ) สัดส่วนรายได้ในประเทศที่ 73% และต่างประเทศที่ 27% ซึ่งเป็นส่วนที่ record high คาด Gross margin ที่ 26.2% ลดลง QoQ แต่ยังคงดีขึ้น YoY จากผลกระทบของต้นทุนวัตถุดิบที่เพิ่มขึ้น เช่น แป้งสาลี ใบกัญชา และค่าล่วงเวลาพนักงานจากการเร่งการผลิต ส่วนแบ่งขาดทุนจาก สิริโปร คาดที่ 5 ล้านบาทเนื่องจากค่าใช้จ่ายด้านพลังงานที่สูงขึ้น โดยใน 1H65 คาดรายได้ของ SNNP ที่ 2,469 ล้านบาท (+14% YoY) และกำไรสุทธิ 220 ล้านบาท(-14% YoY) คิดเป็น 47% ของประมาณกำไรสุทธิที่เราคาดที่ 465 ล้านบาท (+6% YoY)
- ใน 2H65 เราคาดรายได้จะได้แรงหนุนจากยอดขายต่างประเทศที่ยังเติบโตและโรงงานในประเทศเวียดนามคาดเริ่มผลิตส่วนของเฟสที่ 1 ช่วง 2H65 เป็นต้นไป ขณะที่สินค้าใหม่คาดเห็นการปรับขนาดลงของกลุ่ม Jele Beauty Drink เพื่อลดต้นทุนและบริหาร Gross marginขณะที่ขนมเบนโต๊ะผสมใบกัญชาคาดจะเลื่อนการออกสินค้าไปก่อน ส่วน Gross Margin คาดจะทรงตัวใน 2H65 และทิศทางต้นทุนวัตถุดิบได้ผ่านจุดสูงสุดไปแล้ว และส่วนของบริษัทร่วมคือ สิริโปร คาดเริ่มเห็นเป็นกำไรช่วงปลายปี 2565
- การเปิดตัวกลุ่มสินค้าใหม่ขยายธุรกิจกลุ่มเสริมอาหารยังคงล่าช้าจากแผนจาก อย่างไรก็ตามคาดเปิดตัวได้ในปีนี้
- ความเสี่ยง คือต้นทุนการผลิตทั้งแป้งสาลีและน้ำตาลตลาดโลกอยู่ในระดับสูงกว่าปีก่อนและค่าขนส่งยังอยู่ในขาขึ้น กดดันต้นทุน รวมทั้งทิศทางของการขึ้นค่าแรงในปลายปีนี้
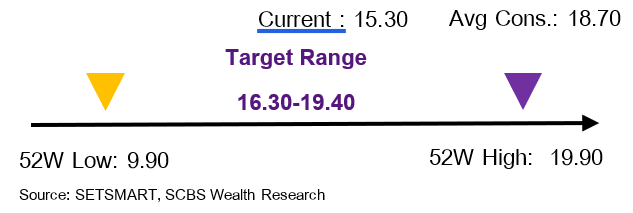
- แนะนำ ซื้อ โดยเราใช้สมมติฐาน PER ที่ 31 เท่าสะท้อนระดับเดียวกับกลุ่มและการเติบโตที่เริ่มมีเสถียรภาพ ราคาเป้ารวมธุรกิจใหม่ปี 2565 เท่ากับ 16.30 บาท/หุ้น และราคาเป้าหมายปี 2566 ที่ 19.40 บาท/หุ้น คาด SNNP จะมีประกาศจ่ายเงินปันผลรอบ 1H65 ที่ประมาณ 0.11-0.13 บาท/หุ้น คิดเป็น Payout Ratio ที่ 50-60% และ Yield ที่ประมาณ 1%
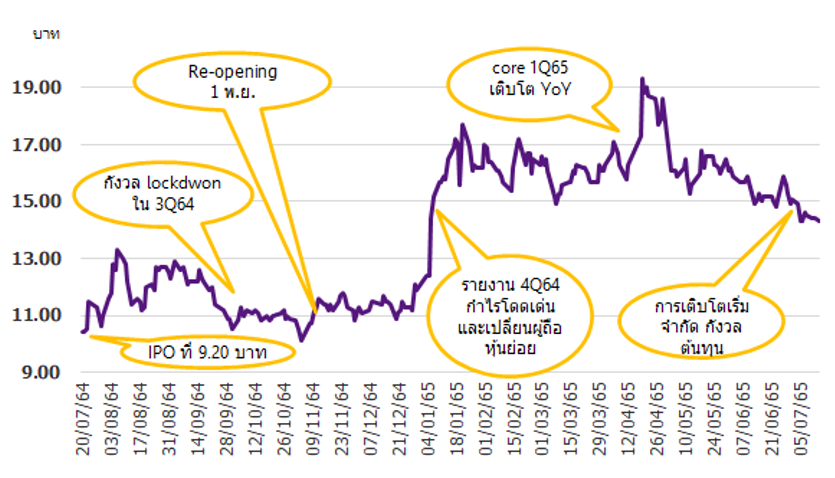
การเคลื่อนไหวของราคาหลังเกิดเหตุการณ์สำคัญ
มุมมองหลังเข้าเยี่ยมชมกิจการครั้งที่ 10

เป้าหมายราคาที่เป็นไปได้
Sustainability / ESG Score
| 2021 Sustainability Index (THSI) | Not Included |
| ESG Bloomberg Score (Total) | n.a. |
| Environmental Score | n.a. |
| Social Score | n.a. |
| Governance Score | n.a. |
Financial Highlight
โครงสร้างรายได้ 2Q65F
นักวิเคราะห์การลงทุนปัจจัยพื้นฐานด้านหลักทรัพย์
เติมพร ตันติวิวัฒน์ 0-2949-1020 l
termporn,[email protected]
EGS Disclosure Score
| 2020 | 2021 | |
|---|---|---|
| ESG Disclosure Score | n.a | n.a |
| Environment | n.a | n.a |
| Total GHG Emissions (thousands of metric tonnes) | n.a | n.a |
| Total Water Use (thousands of cubic meters) | n.a | n.a |
| Hazardous Waste (thousands of metric tonnes) | n.a | n.a |
| Total Waste (thousands of metric tonnes) | n.a | n.a |
| Social | n.a | n.a |
| Number of Employees | n.a | n.a |
| Workforce Accidents | n.a | n.a |
| Lost Time from Accidents | n.a | n.a |
| Fatalities - Contractors | n.a | n.a |
| Fatalities - Employees | n.a | n.a |
| Fatalities - Total | n.a | n.a |
| Community Spending | n.a | n.a |
| Governance | n.a | n.a |
| Size of the Board | n.a | n.a |
| Indep Directors | n.a | n.a |
| % Indep Directors | n.a | n.a |
| Board Duration (Years) | n.a | n.a |
| # Board Meetings | n.a | n.a |
| Board Mtg Attendance (%) | n.a | n.a |
Source: Bloomberg Finance L.P. as of 2021
Disclaimer
การจัดทำข้อมูลด้านสิ่งแวดล้อม สังคมและการกำกับดูแลกิจการที่ดี (Environmental Social Governance หรือ ESG) เป็นการทำข้อมูลและเปิดเผยโดยบริษัท Bloomberg ซึ่งมีการทำข้อมูลด้านสิ่งแวดล้อม ด้านสังคม และด้านธรรมภิบาล อาทิเช่นข้อมูลการใช้พลังงานที่สะท้อนต้นทุน ความเสี่ยงในการพึ่งพาพลังงานของธุรกิจ ความเสี่ยงด้านการทำงานที่อาจจะเกิดจากอุบัติเหตุ รวมถึงสัดส่วนของคณะกรรมการบริหาร ตั้งแต่ปี 2010 และขึ้นอยู่กับการเปิดเผยข้อมูลของแต่ละบริษัท
Financial Statement : 2Q65F Earnings Previews
| FY December 31 (Btmn) | 2Q64 | 3Q64 | 4Q64 | 1Q65 | 2Q65F | %YoY | %QoQ | 1H64 | 1H65F | %Change | |
|---|---|---|---|---|---|---|---|---|---|---|---|
| Total revenue | (Btmn) | 1,068 | 978 | 1,210 | 1,133 | 1,336 | 25.1 | 17.9 | 2,170 | 2,469 | 14% |
| Cost of goods sold | (Btmn) | (795) | (732) | (870) | (823) | (986) | 24.0 | 19.9 | (1,607) | (1,809) | 13% |
| Gross profit | (Btmn) | 273 | 245 | 340 | 310 | 350 | 28.2 | 12.8 | 563 | 660 | 17% |
| SG&A | (Btmn) | (158) | (162) | (197) | (179) | (207) | 31.3 | 15.9 | (378) | (386) | 2% |
| Other income/expense | (Btmn) | (3) | (2) | 6 | 2 | 5 | n.m. | 106.7 | 3 | 7 | 135% |
| Interest expense | (Btmn) | (17) | (4) | (0) | (0) | 0 | n.m. | n.m. | (36) | (0) | -99% |
| Pre-tax profit | (Btmn) | 95 | 77 | 149 | 134 | 148 | 55.7 | 10.4 | 153 | 282 | 84% |
| Corporate tax | (Btmn) | (21) | (17) | (32) | (29) | (33) | 55.2 | 13.6 | (36) | (62) | 73% |
| Equity a/c profits | (Btmn) | (9) | (11) | (6) | (8) | (5) | (42.6) | (38.3) | (10) | (13) | n.m. |
| Minority interests | (Btmn) | 3 | 2 | 5 | 0 | 0 | n.m. | n.m. | 9 | 0 | -95% |
| Core profit | (Btmn) | 77 | 62 | 121 | 105 | 115 | 49.7 | 9.1 | 126 | 220 | 75% |
| Extra-ordinary items | (Btmn) | 0 | 0 | 0 | 0 | 0 | 0.0 | 0.0 | 129 | 0 | n.m. |
| Net Profit | (Btmn) | 77 | 62 | 121 | 105 | 115 | 49.7 | 9.1 | 255 | 220 | -14% |
| EBITDA | (Btmn) | 112 | 81 | 149 | 134 | 148 | 32.0 | 10.3 | 189 | 282 | 49% |
| Core EPS (Bt) | (Bt) | 0.08 | 0.06 | 0.13 | 0.11 | 0.12 | 49.7 | 9.1 | 0.13 | 0.23 | 75% |
| Financial Ratio (%) | |||||||||||
| Gross margin | 25.6 | 25.1 | 28.1 | 27.4 | 26.2 | 26.0 | 26.7 | ||||
| SG&A/Revenue | 14.8 | 16.6 | 16.3 | 15.8 | 15.5 | 17.4 | 15.6 | ||||
| EBITDA margin | 10.5 | 8.3 | 12.3 | 11.8 | 11.1 | 8.7 | 11.4 | ||||
| Net profit margin | 7.2 | 6.3 | 10.0 | 9.3 | 8.6 | 11.7 | 8.9 |
Source: Company data, SCBS Wealth Research
Most Read
1

2


4


Related Articles


Most Read
1
2
4