
สรุปสาระสำคัญ
• Alibaba เผยงบผิดคาด โดยรายได้เติบโตเล็กน้อย 5%YoY ขณะที่กำไรลดลงราว 77%YoY หลังได้รับผลกระทบจากการเปลี่ยนแปลงการประเมินมูลค่าตราสารทุนและการด้อยค่าทางบัญชีที่เกี่ยวข้องกับธุรกิจไฮเปอร์มาร์เก็ต
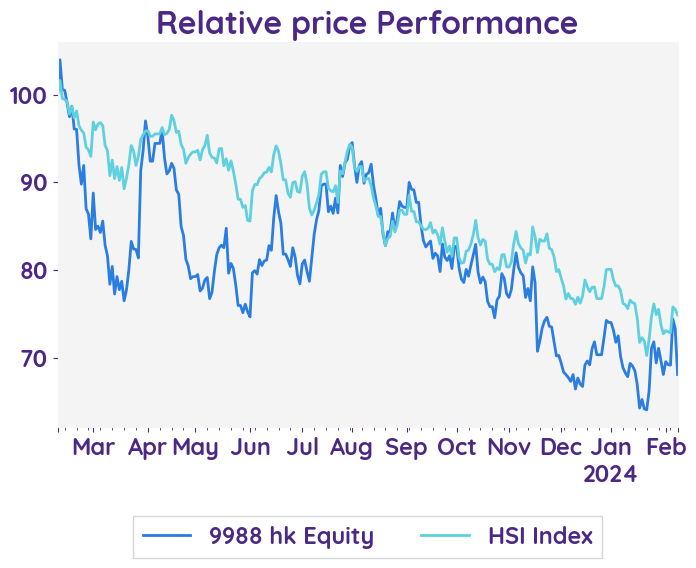
• งบที่อ่อนแอและความกังวลจากแรงกดดันด้านการแข่งขันทางราคาที่รุนแรงในอุตฯคอมเมิซ ทำให้ราคาหุ้น ADR ในตลาดสหรัฐฯปิดปรับตัวลงราว -5.9%
• ด้าน Bloomberg ให้ราคาเป้าหมาย Alibaba ไว้ที่ 108.6HKD ซึ่งมี Upside 45% จากราคาปัจจุบัน


 08 February 2024
Alibaba Group Holding Limited
9988.hk
08 February 2024
Alibaba Group Holding Limited
9988.hk
Bloomberg 9988.hk
Reuters 9988.hk
Alibaba Group's revenue falls short of expectations, continuing to grapple with a price war.
Earnings Result
The comparison between the previous and current quarters of Alibaba Group's financial results reveals a significant shift in the company's outlook. While the previous quarter showcased positive growth and improved profitability, the current quarter presents challenges with decreases in net income and income from operations. These declines were primarily attributed to mark-to-market changes from equity investments and impairment of intangible assets and goodwill. Despite these setbacks, Alibaba remains committed to its strategies and business plans for future growth. It is important to note, however, that forward-looking statements provided by the company come with inherent risks and uncertainties.
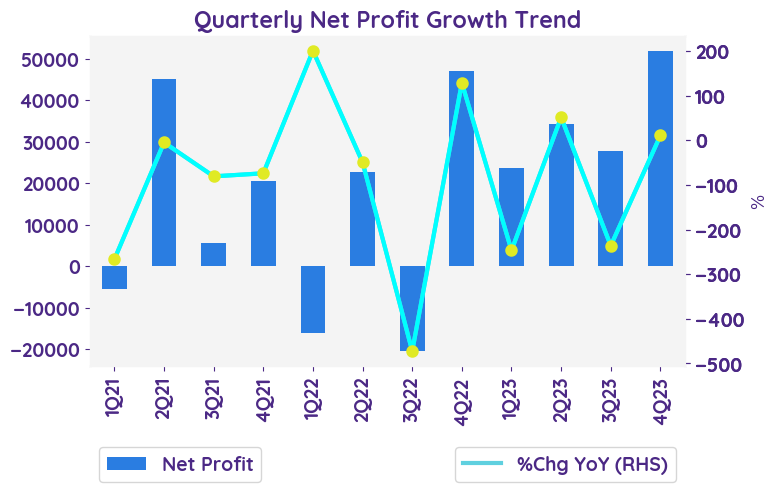
Net profit growth QoQ and YoY
The net profit for the quarter ended December 31, 2023, was RMB10,717 million, a significant decrease of 77% compared to RMB45,746 million in the same quarter of 2022 and also missed estimates. This decline in net profit indicates a negative growth in profitability year-over-year.
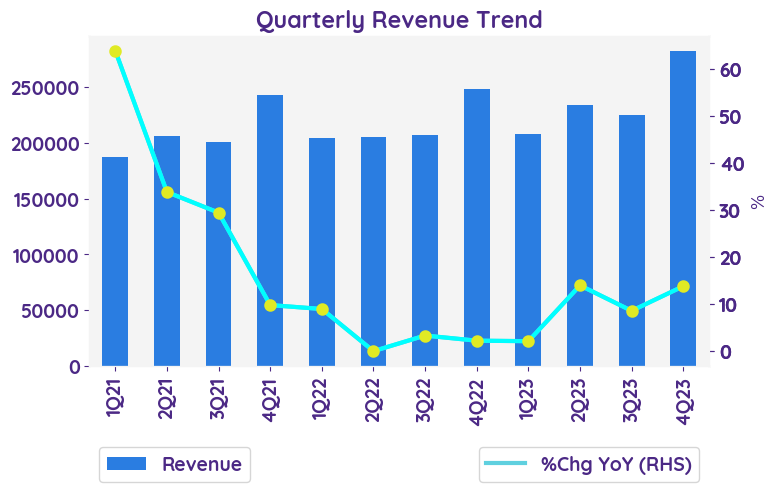
Revenue growth of each business
In the quarter ended December 31, 2023, the revenue from Alibaba's China commerce retail business increased by 1% compared to the same quarter of 2022 but missed expectation. This growth was primarily driven by healthy growth in online GMV generated on Taobao and Tmall, offset by a decline in overall take rate. Revenue from the China commerce wholesale business increased by 23% due to an increase in revenue from value-added services provided to paying members. The Cloud Intelligence Group also experienced revenue growth of 3%, driven by revenue from public cloud products and services.
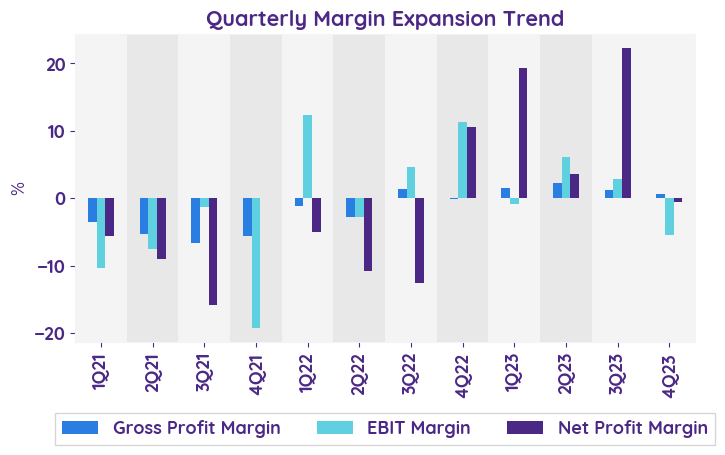
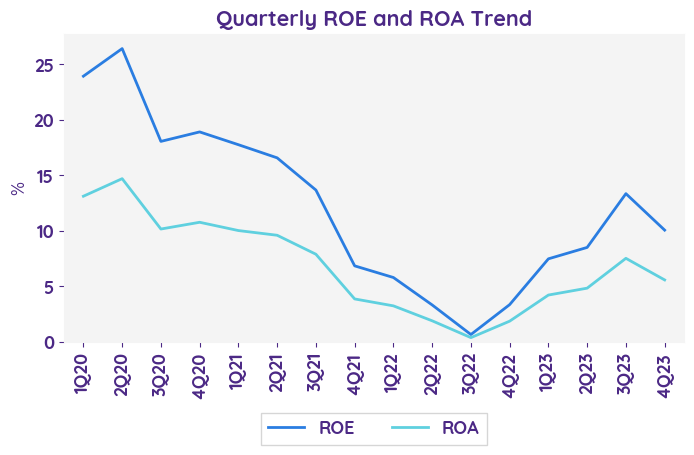
Operating margin
The operating margin for the quarter ended December 31, 2023, was 9%, a decrease of 36% compared to the same quarter in 2022. This decrease was primarily due to the impairment of intangible assets of Sun Art and impairment of goodwill of Youku. However, adjusted EBITDA and adjusted EBITA increased by 1% and 2% respectively, primarily driven by revenue growth and improved operating efficiency.
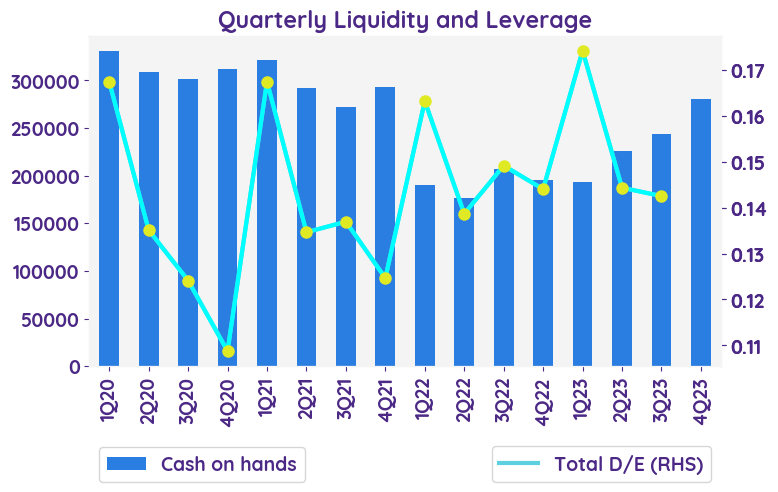
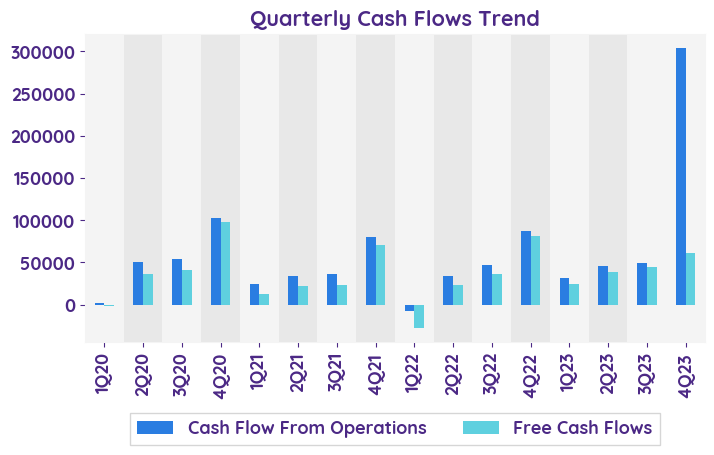
Balance sheet and cashflow
Net cash provided by operating activities for the quarter ended December 31, 2023, was RMB64,716 million, a decrease of 26% compared to the same quarter in 2022. Free cash flow, a non-GAAP measurement of liquidity, was RMB56,540 million, a decrease of 31% compared to the previous year. The decrease in free cash flow was attributed to increased capital expenditures and one-time factors such as timing of income tax payments and working capital changes. Net cash used in investing activities was RMB30,925 million, primarily reflecting an increase in other treasury investments and capital expenditures. Net cash used in financing activities was RMB17,214 million, primarily due to cash used in repurchase of ordinary shares.
Risks and concerns
The current risks that Alibaba is facing include its corporate structure, maintaining the trusted status of its ecosystem, competition and innovation, economic and business conditions, geopolitical tensions, acquisitions and investments, complex laws and regulations, cybersecurity risks, and the impact of the COVID-19 pandemic.
The comparison between the previous and current quarters of Alibaba Group's financial results reveals a significant shift in the company's outlook. While the previous quarter showcased positive growth and improved profitability, the current quarter presents challenges with decreases in net income and income from operations. These declines were primarily attributed to mark-to-market changes from equity investments and impairment of intangible assets and goodwill. Despite these setbacks, Alibaba remains committed to its strategies and business plans for future growth. It is important to note, however, that forward-looking statements provided by the company come with inherent risks and uncertainties.
Net profit growth QoQ and YoY
The net profit for the quarter ended December 31, 2023, was RMB10,717 million, a significant decrease of 77% compared to RMB45,746 million in the same quarter of 2022 and also missed estimates. This decline in net profit indicates a negative growth in profitability year-over-year.
Revenue growth of each business
In the quarter ended December 31, 2023, the revenue from Alibaba's China commerce retail business increased by 1% compared to the same quarter of 2022 but missed expectation. This growth was primarily driven by healthy growth in online GMV generated on Taobao and Tmall, offset by a decline in overall take rate. Revenue from the China commerce wholesale business increased by 23% due to an increase in revenue from value-added services provided to paying members. The Cloud Intelligence Group also experienced revenue growth of 3%, driven by revenue from public cloud products and services.
Operating margin
The operating margin for the quarter ended December 31, 2023, was 9%, a decrease of 36% compared to the same quarter in 2022. This decrease was primarily due to the impairment of intangible assets of Sun Art and impairment of goodwill of Youku. However, adjusted EBITDA and adjusted EBITA increased by 1% and 2% respectively, primarily driven by revenue growth and improved operating efficiency.
Balance sheet and cashflow
Net cash provided by operating activities for the quarter ended December 31, 2023, was RMB64,716 million, a decrease of 26% compared to the same quarter in 2022. Free cash flow, a non-GAAP measurement of liquidity, was RMB56,540 million, a decrease of 31% compared to the previous year. The decrease in free cash flow was attributed to increased capital expenditures and one-time factors such as timing of income tax payments and working capital changes. Net cash used in investing activities was RMB30,925 million, primarily reflecting an increase in other treasury investments and capital expenditures. Net cash used in financing activities was RMB17,214 million, primarily due to cash used in repurchase of ordinary shares.
Risks and concerns
The current risks that Alibaba is facing include its corporate structure, maintaining the trusted status of its ecosystem, competition and innovation, economic and business conditions, geopolitical tensions, acquisitions and investments, complex laws and regulations, cybersecurity risks, and the impact of the COVID-19 pandemic.
| Revenue - %Chg YoY | 1Q23 | 2Q23 | 3Q23 | 4Q23 | 1Q24 |
|---|---|---|---|---|---|
| Taobao & Tmall Group | 12.1% | 4.2% | 1.6% | 5.8% | 2.5% |
| International Digital Commerce | 43.2% | 55.7% | 46.5% | 32.8% | 22.1% |
| Local Services Group | 29.8% | 16.3% | 13.2% | 13.2% | 13.5% |
| Cainiao Smart Logistics Network | 90.8% | 70.7% | 72.0% | 57.0% | 14.6% |
| Sentiment | 2Q23 | 3Q23 | 4Q23 | 1Q24 |
|---|---|---|---|---|
| net profit | Positive | Positive | Positive | Negative |
| margin | Neutral | Positive | Positive | Neutral |
| revenue | Neutral | Positive | Positive | Positive |
| Stock data | |
|---|---|
| Market Cap (HKD Billion) | 1415.16 |
| Beta | 1.66 |
| Last close | 69.55 |
| 12-m Low / High | 64.6 / 108.5 |
| Target price | 110.00 |
| Return Potential | 58.2 % |
| % of Buy / Sell rating | 97.0 % / 0.0 % |
| Valuation data | 12m Forward | 5-Yr Average |
|---|---|---|
| P/E | 7.88 | |
| P/B | 1.21 | |
| P/S | 1.38 | |
| EV/EBITDA | 3.98 | |
| Dividend Yield | 0.0 % |
Alibaba Group Holding Limited
Alibaba Group Holding Limited provides online sales services. The Company provides internet infrastructure, electronic commerce, online financial, and internet content services through its subsidiaries. Alibaba Group Holding offers its products and services worldwide.
Most Read
1

2


4


Related Articles


Most Read
1
2
4