
สรุปสาระสำคัญ
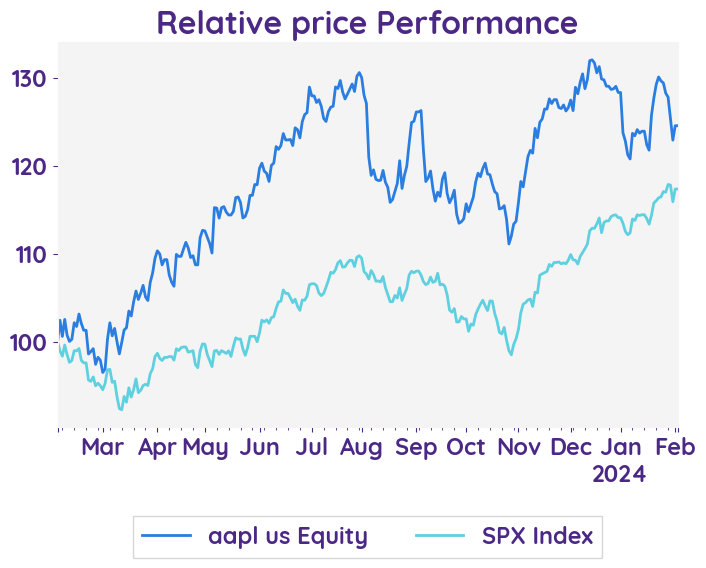
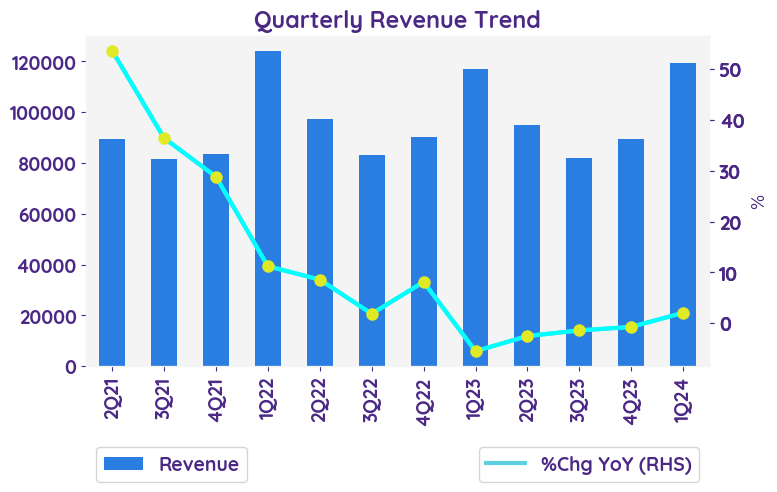
• Apple เผยงบดีกว่าคาด โดยรายได้เพิ่มขึ้น 2%YoY กลับมาเติบโตเป็นบวกครั้งแรกหลังจากหดตัว 4 ไตรมาสติดต่อกัน
• ด้านกำไรต่อหุ้นเพิ่มขึ้นแตะ $2.1 อย่างไรก็ดียอดขายในจีนยังคงลดลง 13%YoY ซึ่งผิดคาดเกือบ 20% หลังมีแรงกดดันจากการแข่งขันที่สูง รวมถึงคาดการณ์ยังคงอ่อนแอส่งผลให้ราคาหุ้นของ Apple ปรับตัวลดลง 3% ในช่วงตลาด After Hour
• ด้าน Bloomberg ให้ราคาเป้าหมายไว้ที่ 200.0 USD ซึ่งมี Upside 7% จากราคาปัจจุบัน


 02 February 2024
Apple Inc.
AAPL.US
Bloomberg AAPL.US
Reuters AAPL.OQ
Apple Beat Estimates, But Revenue Growth Falters in Key China Market
Earnings Result
In comparing the previous quarter to the current quarter, Apple Inc. has shown significant growth in net sales. The previous quarter saw net sales of $89.5 billion, while the current quarter reported net sales of $119.6 billion. This increase can be attributed to strong performance in iPhone sales, which reached $69.7 billion in the current quarter. Additionally, the company's net income for the current quarter was $33.9 billion, a substantial increase from the previous quarter's net income of $22.9 billion. These positive financial results indicate a continued upward trend for Apple Inc. and highlight its success in the market.
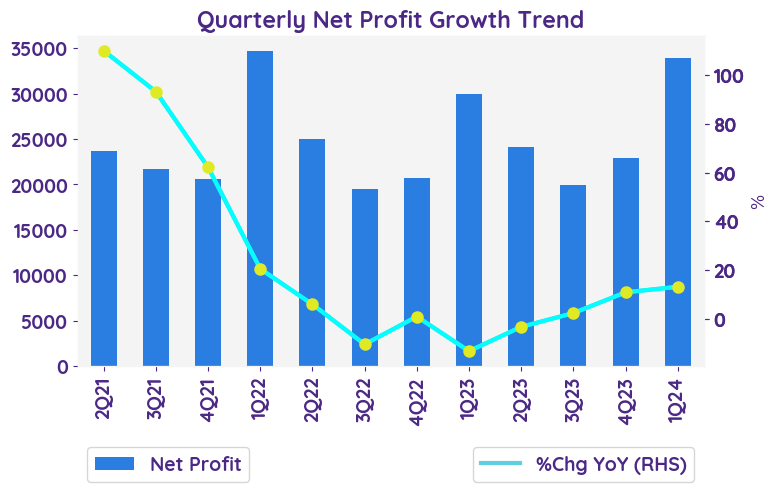
Net profit growth QoQ and YoY
The net profit of Apple Inc. increased from $29,998 million in Q4 2022 to $33,916 million in Q1 2024, representing a year-on-year (YoY) growth of approximately 13% and beat estimated.
Revenue growth of each business
Apple posted revenues of $119.58 billion for the quarter ended December 2023, surpassing estimate. This compares to year-ago revenues of $117.15 billion. Overall, Apple Inc. experienced revenue growth in most of its business segments, except for Greater China and the Wearables, Home and Accessories category. The Americas and Europe segments showed positive revenue growth, while the Japan and Rest of Asia Pacific segments also experienced growth. The iPhone and Mac categories also showed revenue growth, while the iPad and Wearables, Home and Accessories categories experienced a decline. The Services category showed significant revenue growth.
Operating margin
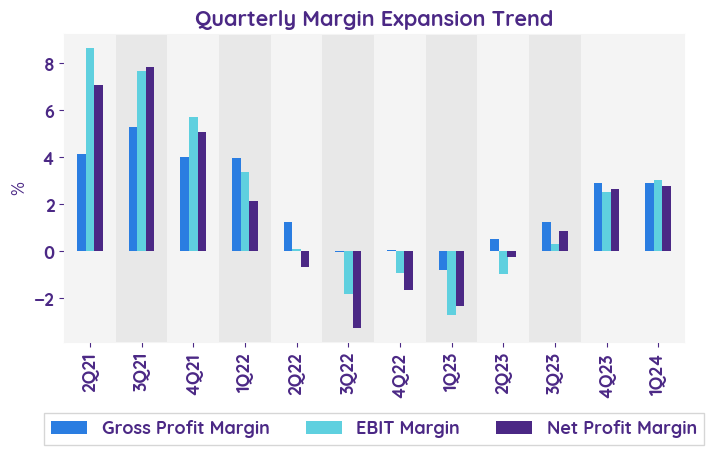
In 1Q24, the operating income was $40,373 million and the total net sales were $119,575 million. Therefore, the operating margin for this period was approximately 33.8%.
Balance sheet and cashflow
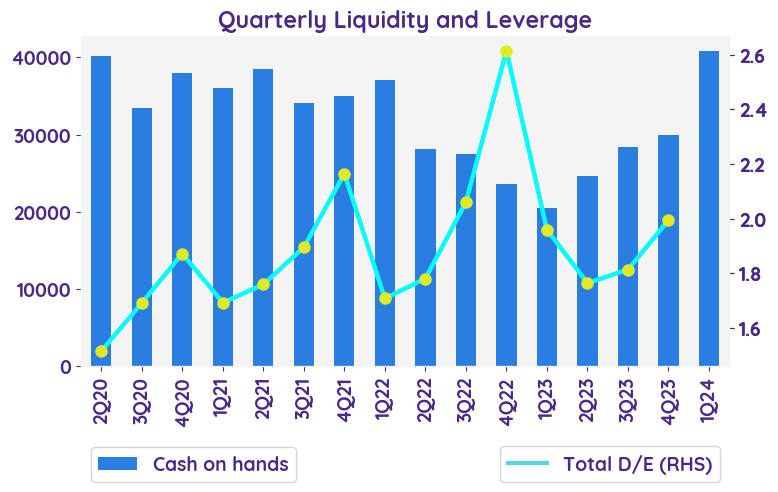
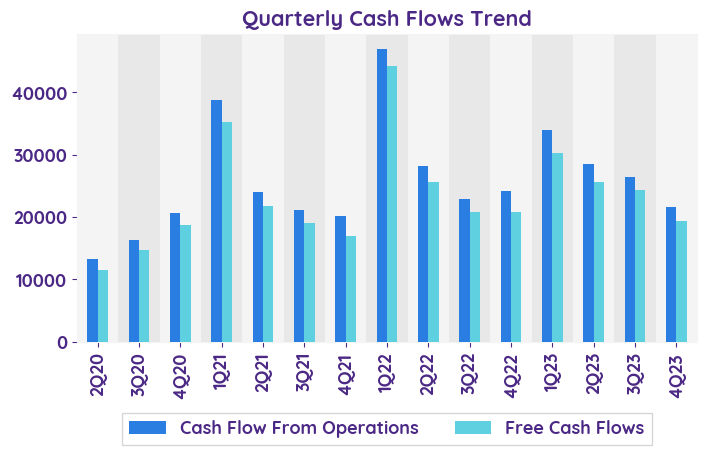
Based on the extracted parts of the earnings report, the balance sheet shows that Apple Inc. has a significant amount of cash and cash equivalents, marketable securities, and accounts receivable. The company also has a substantial amount of non-current assets, including marketable securities and property, plant, and equipment. On the liabilities side, Apple Inc. has both current and non-current liabilities, including accounts payable, deferred revenue, and term debt. The shareholders' equity section shows the company's common stock and additional paid-in capital, retained earnings, and accumulated other comprehensive loss. The cash flow statement indicates that Apple Inc. generated a significant amount of cash from operating activities, had positive cash flow from investing activities, and used cash in financing activities. Overall, the balance sheet and cash flow analysis suggest that Apple Inc. has a strong financial position with a substantial amount of cash and assets, but also has significant liabilities and uses cash for financing activities.
Apple Outlook Clouds with iPhone Sales Dip and Lower Revenue Forecast
Apple's stock faces headwinds after its Q1 outlook revealed a surprising dip in iPhone sales and overall revenue falling short of expectations by $6 billion. This news comes on the heels of China's impact on their business, leading to a projected $5 billion decline in revenue compared to last year's iPhone restocking surge.
| Revenue - %Chg YoY | 2Q23 | 3Q23 | 4Q23 | 1Q24 | 2Q24E |
|---|---|---|---|---|---|
| iPhone | 1.5% | -2.4% | 2.8% | 6.0% | -0.4% |
| iPad | -12.8% | -19.8% | -10.2% | -25.3% | -1.5% |
| Mac | -31.3% | -7.3% | -33.8% | 0.6% | 5.4% |
| Wearables, Home & Accessories | -0.6% | 2.5% | -3.4% | -11.3% | 7.1% |
| Sentiment | 2Q23 | 3Q23 | 4Q23 | 1Q24 |
|---|---|---|---|---|
| net profit | Positive | Positive | Positive | Positive |
| margin | Neutral | Neutral | Neutral | Positive |
| revenue | Neutral | Neutral | Neutral | Positive |
| Stock data | |
|---|---|
| Market Cap (USD Million) | 2889.21 |
| Beta | 1.20 |
| Last close | 186.86 |
| 12-m Low / High | 143.9 / 199.6 |
| Target price | 200.00 |
| Return Potential | 7.0 % |
| % of Buy / Sell rating | 63.0 % / 11.0 % |
| Valuation data | 12m Forward | 5-Yr Average |
|---|---|---|
| P/E | 27.66 | 26.30 |
| P/B | 41.40 | 33.67 |
| P/S | 7.32 | 6.18 |
| EV/EBITDA | 21.12 | 19.89 |
| Dividend Yield | 0.0 % |
Apple Inc.
Apple Inc. designs, manufactures, and markets smartphones, personal computers, tablets, wearables and accessories, and sells a variety of related accessories. The Company also offers payment, digital content, cloud and advertising services. Apple Inc.'s customers are primarily in consumer, small & mid-sized business, education, enterprise and government markets worldwide.
Related Articles